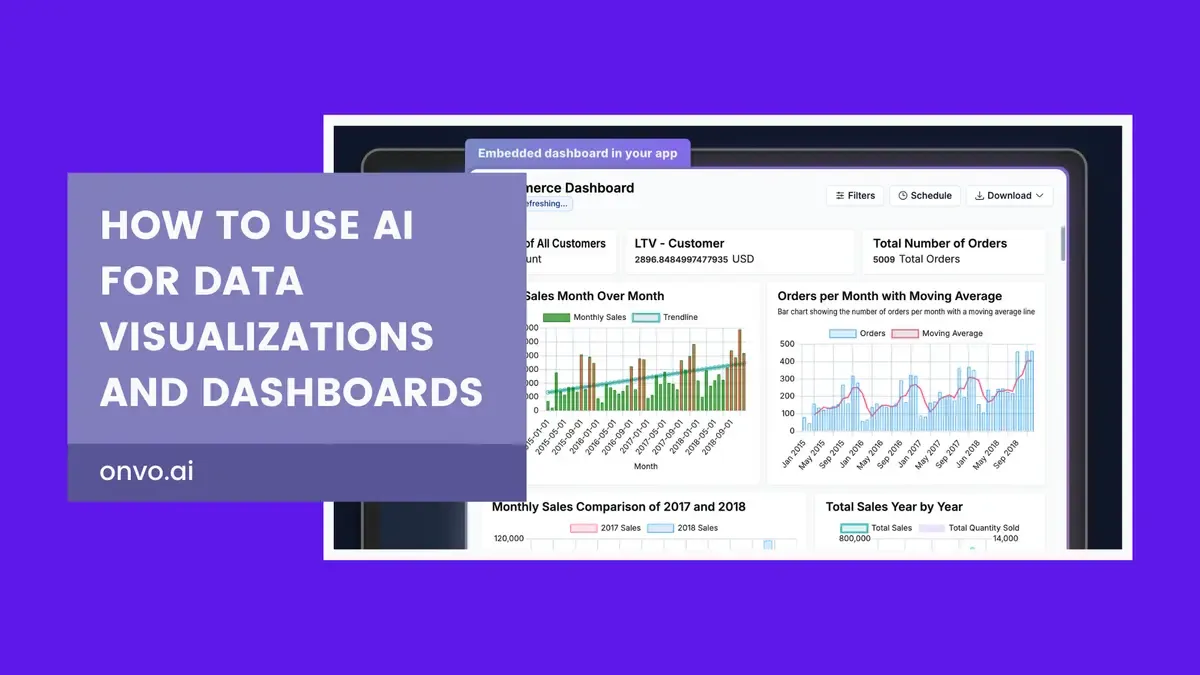
How To Use AI for Data Visualizations and Dashboards
In today's data-driven world, making sense of vast amounts of information is crucial. Artificial Intelligence (AI) is transforming how we visualize data, making it easier to understand and act upon. This blog will explore how AI enhances data visualizations and dashboards, providing practical insights for businesses and individuals.
Understanding AI in Data Visualization
Data visualization involves presenting data in graphical formats like charts and graphs, making complex information more accessible. AI takes this a step further by automating the creation of these visuals and offering deeper insights. Here's how AI is changing the landscape:
- Automated Chart Selection: AI analyzes your data and suggests the most effective chart types, saving time and ensuring clarity.
- Real-Time Data Updates: AI-powered dashboards can automatically refresh data, providing up-to-date information without manual intervention.
- Predictive Analytics: AI can forecast trends based on historical data, helping businesses anticipate changes and make informed decisions.

Key AI Technologies Enhancing Data Dashboards
Several AI technologies are integral to modern data dashboards:
1. Natural Language Generation (NLG)
NLG converts complex data into plain English narratives. Instead of interpreting raw numbers, users receive easy-to-understand summaries. For example, an NLG system might analyze sales data and produce a report stating, "Sales increased by 15% in March due to a surge in online purchases."
2. Natural Language Querying (NLQ)
NLQ allows users to interact with data using everyday language. By typing questions like, "What were our top-selling products last quarter?" the system generates relevant visualizations or reports. This makes data exploration accessible to everyone, regardless of technical expertise.
Benefits of Integrating AI into Data Dashboards
Incorporating AI into your data visualization processes offers numerous advantages:
- Enhanced Accessibility: AI tools break down technical barriers, enabling all team members to engage with data meaningfully.
- Improved Accuracy: Automated data processing reduces the risk of human error, leading to more reliable insights.
- Time Efficiency: AI handles repetitive tasks, freeing up time for strategic analysis and decision-making.
- Personalized Insights: AI can tailor dashboards to individual user needs, highlighting the most relevant information for each person.

Best Practices for Implementing AI in Data Visualization
To maximize the benefits of AI in your data visualizations, consider the following practices:
- Align with Business Goals: Ensure that your AI initiatives support your organization's objectives. Focus on areas where AI can deliver the most value.
- Ensure Data Quality: AI systems rely on accurate data. Regularly clean and update your datasets to maintain reliability.
- Promote User Training: Educate your team on how to use AI-powered tools effectively. This fosters a data-driven culture and encourages adoption.
- Start Small and Scale: Begin with pilot projects to demonstrate AI's value before expanding its use across the organization.
- Monitor and Iterate: Continuously assess the performance of AI tools and make adjustments as needed to improve outcomes.
Future Trends in AI and Data Visualization
The integration of AI in data visualization is an evolving field. Emerging trends include:
- Increased Automation: AI will further automate data analysis, allowing for more complex insights with minimal manual effort.
- Enhanced Interactivity: Future dashboards may incorporate voice and gesture controls, making interactions more intuitive.
- Deeper Insights: As AI algorithms advance, they will uncover more nuanced patterns and predictions, offering a competitive edge.
Conclusion
Embracing AI in data visualizations and dashboards transforms raw data into actionable insights. By leveraging technologies like NLG and NLQ, businesses can make informed decisions swiftly and accurately. Staying abreast of best practices and emerging trends ensures that your organization remains at the forefront of this data revolution.
For more information on implementing AI in your data visualization strategies, consider exploring resources from reputable analytics platforms.
