Curated for data enthusiasts
Latest from our blogs
Explore our blog for in-depth articles, case studies, and expert perspectives on how technology in data is transforming industries.
Explore our blog for in-depth articles, case studies, and expert perspectives on how technology in data is transforming industries.

We've had a busy second quarter in 2024 with a host of updates and improvements, so here goes!
You can now add filter bars to a dashboard to allow users to quickly filter the data present on the dashboards. We have released an updated documentation page available here if you are interested in trying it out.
You can now zoom into bar charts to look at a certain section of the data and you can then pan around to see the rest of the data as well.
We have added a rich text editor in case you want to add supporting text about the data. You will be able to use AI to auto generate the text based on the data in your dashboard in an update that will be rolled out shortly.
In addition to adding text to a dashboard, you can now also add images like logos into your dashboards
You can now customise the layout of dashboards for desktop and mobile independently making sure your dashboards look their best regardless of screen size
There is now a universal search box that lets you quickly navigate to exactly where you want in the platform. Just hit Cmd+K on a mac or Ctrl+K anywhere in the app to bring it up or hit the search icon on the sidebar.
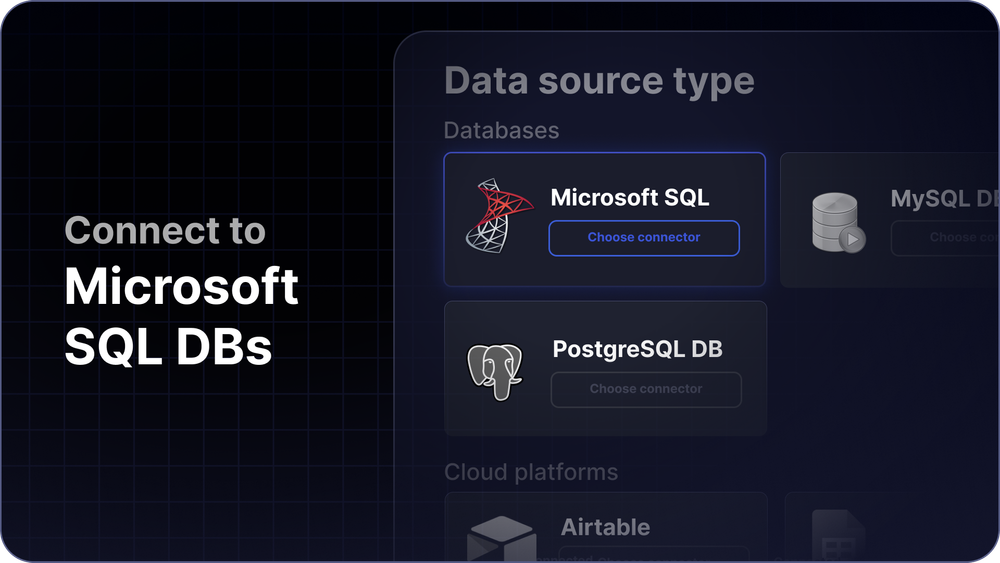
You can now pull in data from Microsoft SQL databases to create your dashboards

Master the art of dashboards and data visualization by leveraging our full suite of powerful tools.