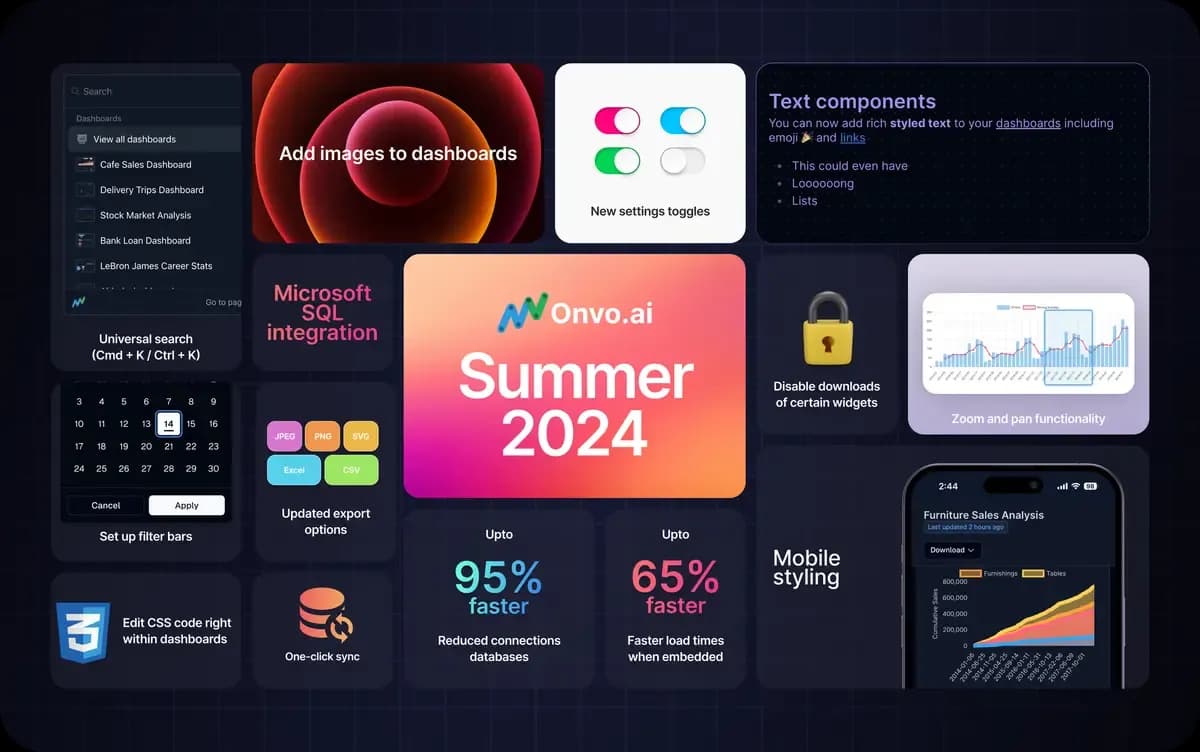
What's New

New updates and improvements to Onvo AI.

Automation conditions & webhooks

Automation conditions & webhooks
Since we launched automations last year, a highly requested add on has been the ability to send reports when a certain condition is met. For example if the weekly sales calls fall below a certain threshold. Or if the visitor number for this week is less than last weeks. To address this, we have launched automation conditions. Automation conditions allow you to only send out reports when one or all conditions you specify are met. Each condition can also be set to be static (referencing a fixed v

Continue reading

New embed options

New embed options
We have allowed dashboards to be embedded through iframes since we launched, but now we're taking things a step further by creating two new embeddable objects - a list of all dashboards available as well as a new copilot component. Change to the base url The base url of all embed objects has changed from https://dashboard.onvo/ai/embed to https://embed.onvo.ai. This will let us make sure the embed platform has high availability and uptime and is ready for the unique challenges of making a web

Continue reading

Tabs update

Tabs update
From a lot of user requests, we noticed that adding multiple tabs on a dashboard was a priority. It helps provide segment the data on a dashboard into useful sections that are easy to navigate. It also helps when building out reports to separate out content into separate pages. And so, we have updated our dashboards to allow for multiple tabs to be setup. Setting up tabs All dashboards have a single tab by default. You can head into a dashboard, click on setting and you should see a section t

Continue reading

New chart types - Maps, sankey, word cloud, matrix

New chart types - Maps, sankey, word cloud, matrix
We're launching a few highly requested chart types to Onvo AI. All these charts are fully customizable and can be generated by just prompting in natural language. Map This displays a world map centered around your points of interest. You can use this chart to plot points, lines and polygons on a map. This chart was developed by the team at Onvo AI and in the spirit of open source, this chart type is built as an open source library. You can find it the link below if you are interested in usin

Continue reading

Launching 500+ new integrations!

Launching 500+ new integrations!
We understand that as SaaS tools evolve, more and more data is being stored on disconnected systems. So to end the year on a high note, we went ahead and got Onvo AI to pull in data from over 500 systems. The integration list is extensive and covers platforms from all domains: 1. Finance tools like Quickbooks Sage 2. CRM platforms like Salesforce and Hubspot 3. Marketing tools like Google ads, Facebook ads 4. Analytics tools like Mixpanel and Google Analytics 5. Developer tools like Strip

Continue reading

Summer 2024 launch update

Summer 2024 launch update
We've had a busy second quarter in 2024 with a host of updates and improvements, so here goes! Added a filter bar for dashboards You can now add filter bars to a dashboard to allow users to quickly filter the data present on the dashboards. We have released an updated documentation page available here if you are interested in trying it out. 0:00 /0:33 1× Add zoom and pan functionality into charts You can now zoom into bar charts to look at a certa

Continue reading

Spring 2024 launch update

Spring 2024 launch update
This is our first quarterly update with updates we have shipped over the last 3 months and we aim to keep this a recurring series as we go along. We'll be using this to talk about some of the important updates we have shipped as well as highlight some of our community projects as well. Updated react package We have updated our react package to reach feature parity with dashboards on our platform. This means you can now edit widgets, ask questions and everything else provided by our platform.

Continue reading

Customising the look and feel of embedded dashboards

Customising the look and feel of embedded dashboards
This is the third in a series of posts about integrating dashboards and reports into your product When using an iframe If you embed dashboards using the iframe method, you can make changes to the UI by heading over to https://dashboard.onvo.ai/dashboards/:dashboard-id/settings. Here you will find multiple options to customise. Dashboard theme: This lets you set if you want the dashboard to adapt to the user's computers preference, or to lock it to light / dark theme. Dashboard font: This le

Continue reading

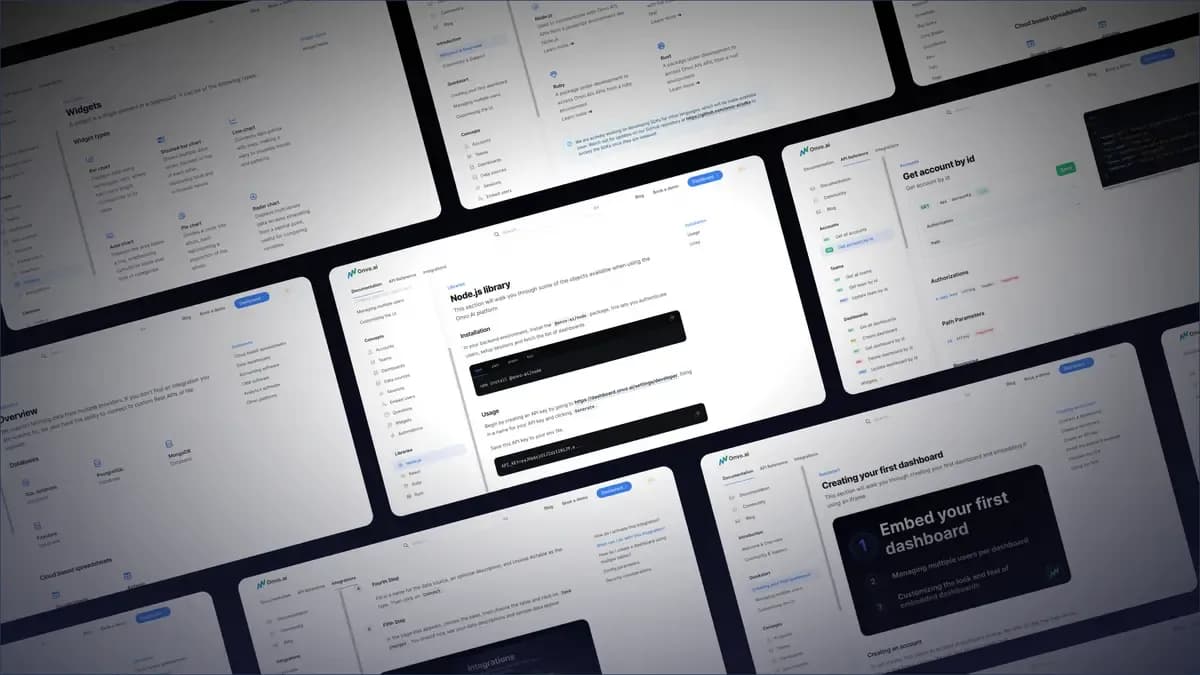
The data first platform

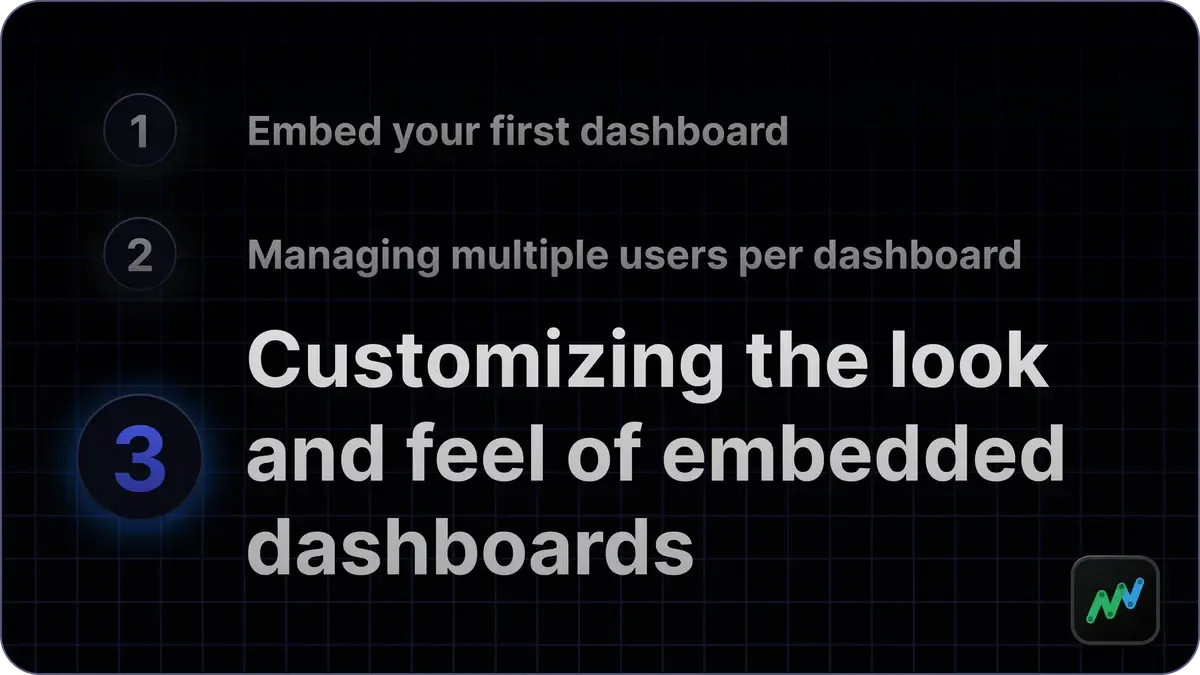
Need a hand? We'll show you how!

Master the art of dashboards and data visualization by leveraging our full suite of powerful tools. Stay in the loop with everything you need to know to start using Onvo AI