Writing better AI prompts for Dashboard Generation
This guide provides detailed steps on how to write effective AI prompts for generating a variety of charts using the Onvo AI platform. By crafting clear and concise prompts, you can enhance the AI’s ability to understand your data and produce insightful visualizations.
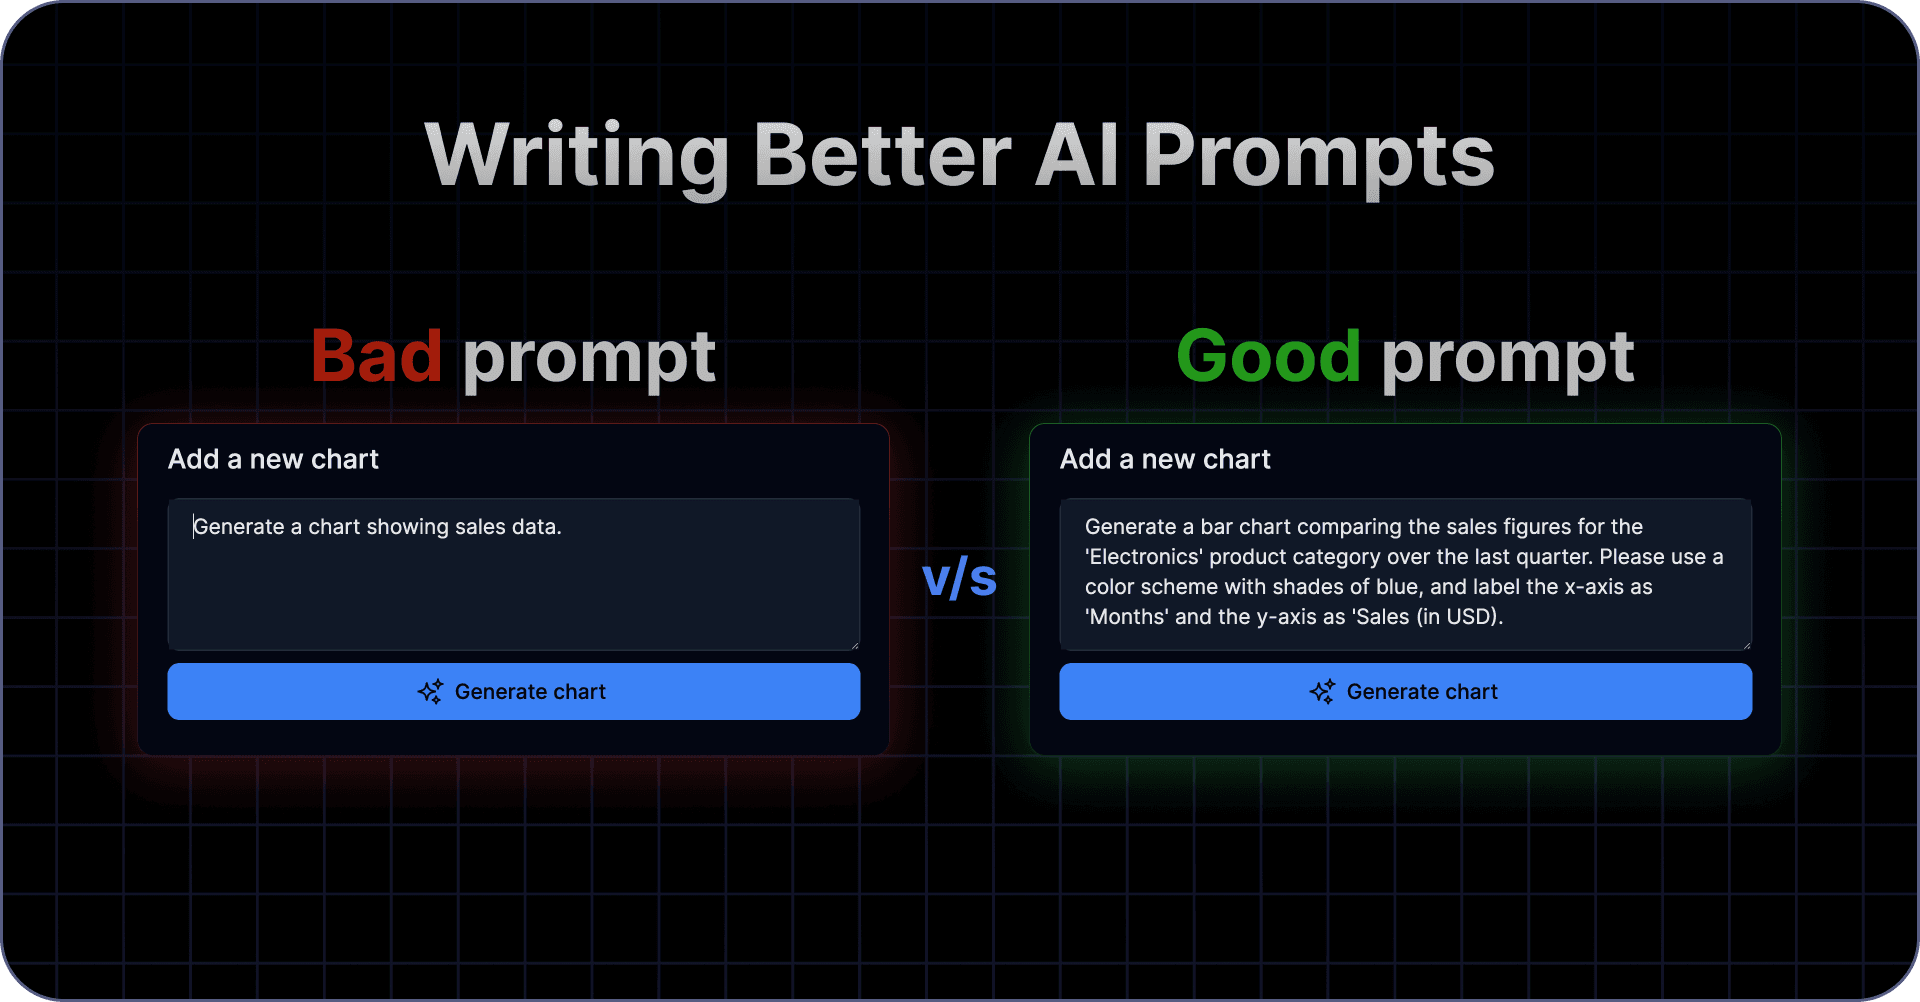
Define the Chart Type
Choosing the right chart type is essential. Each chart type serves a different purpose:
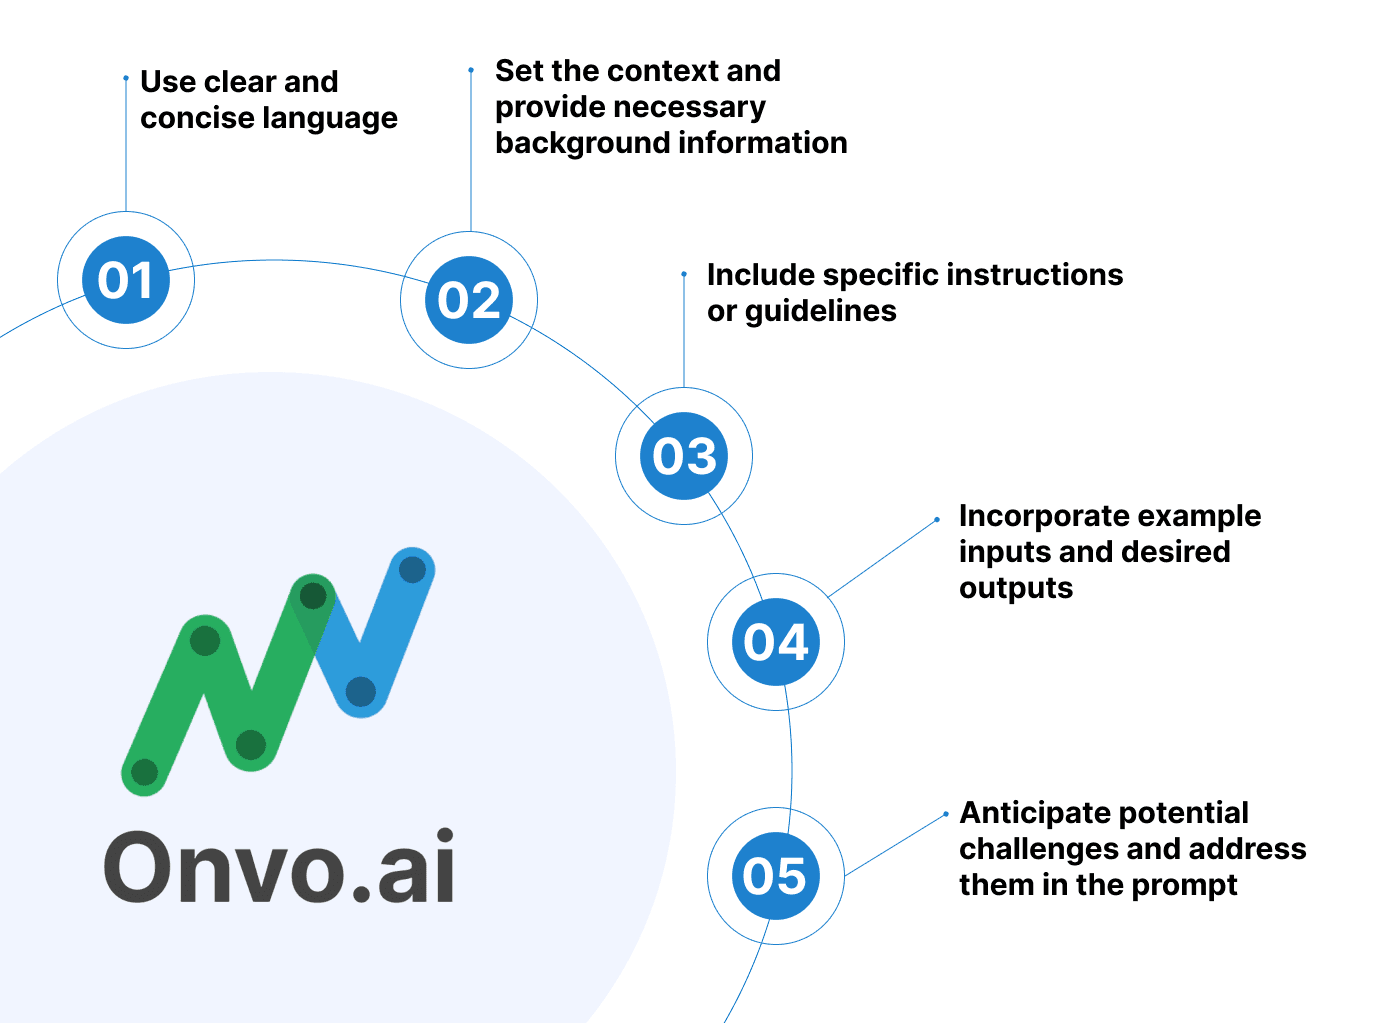
Specify Data Fields
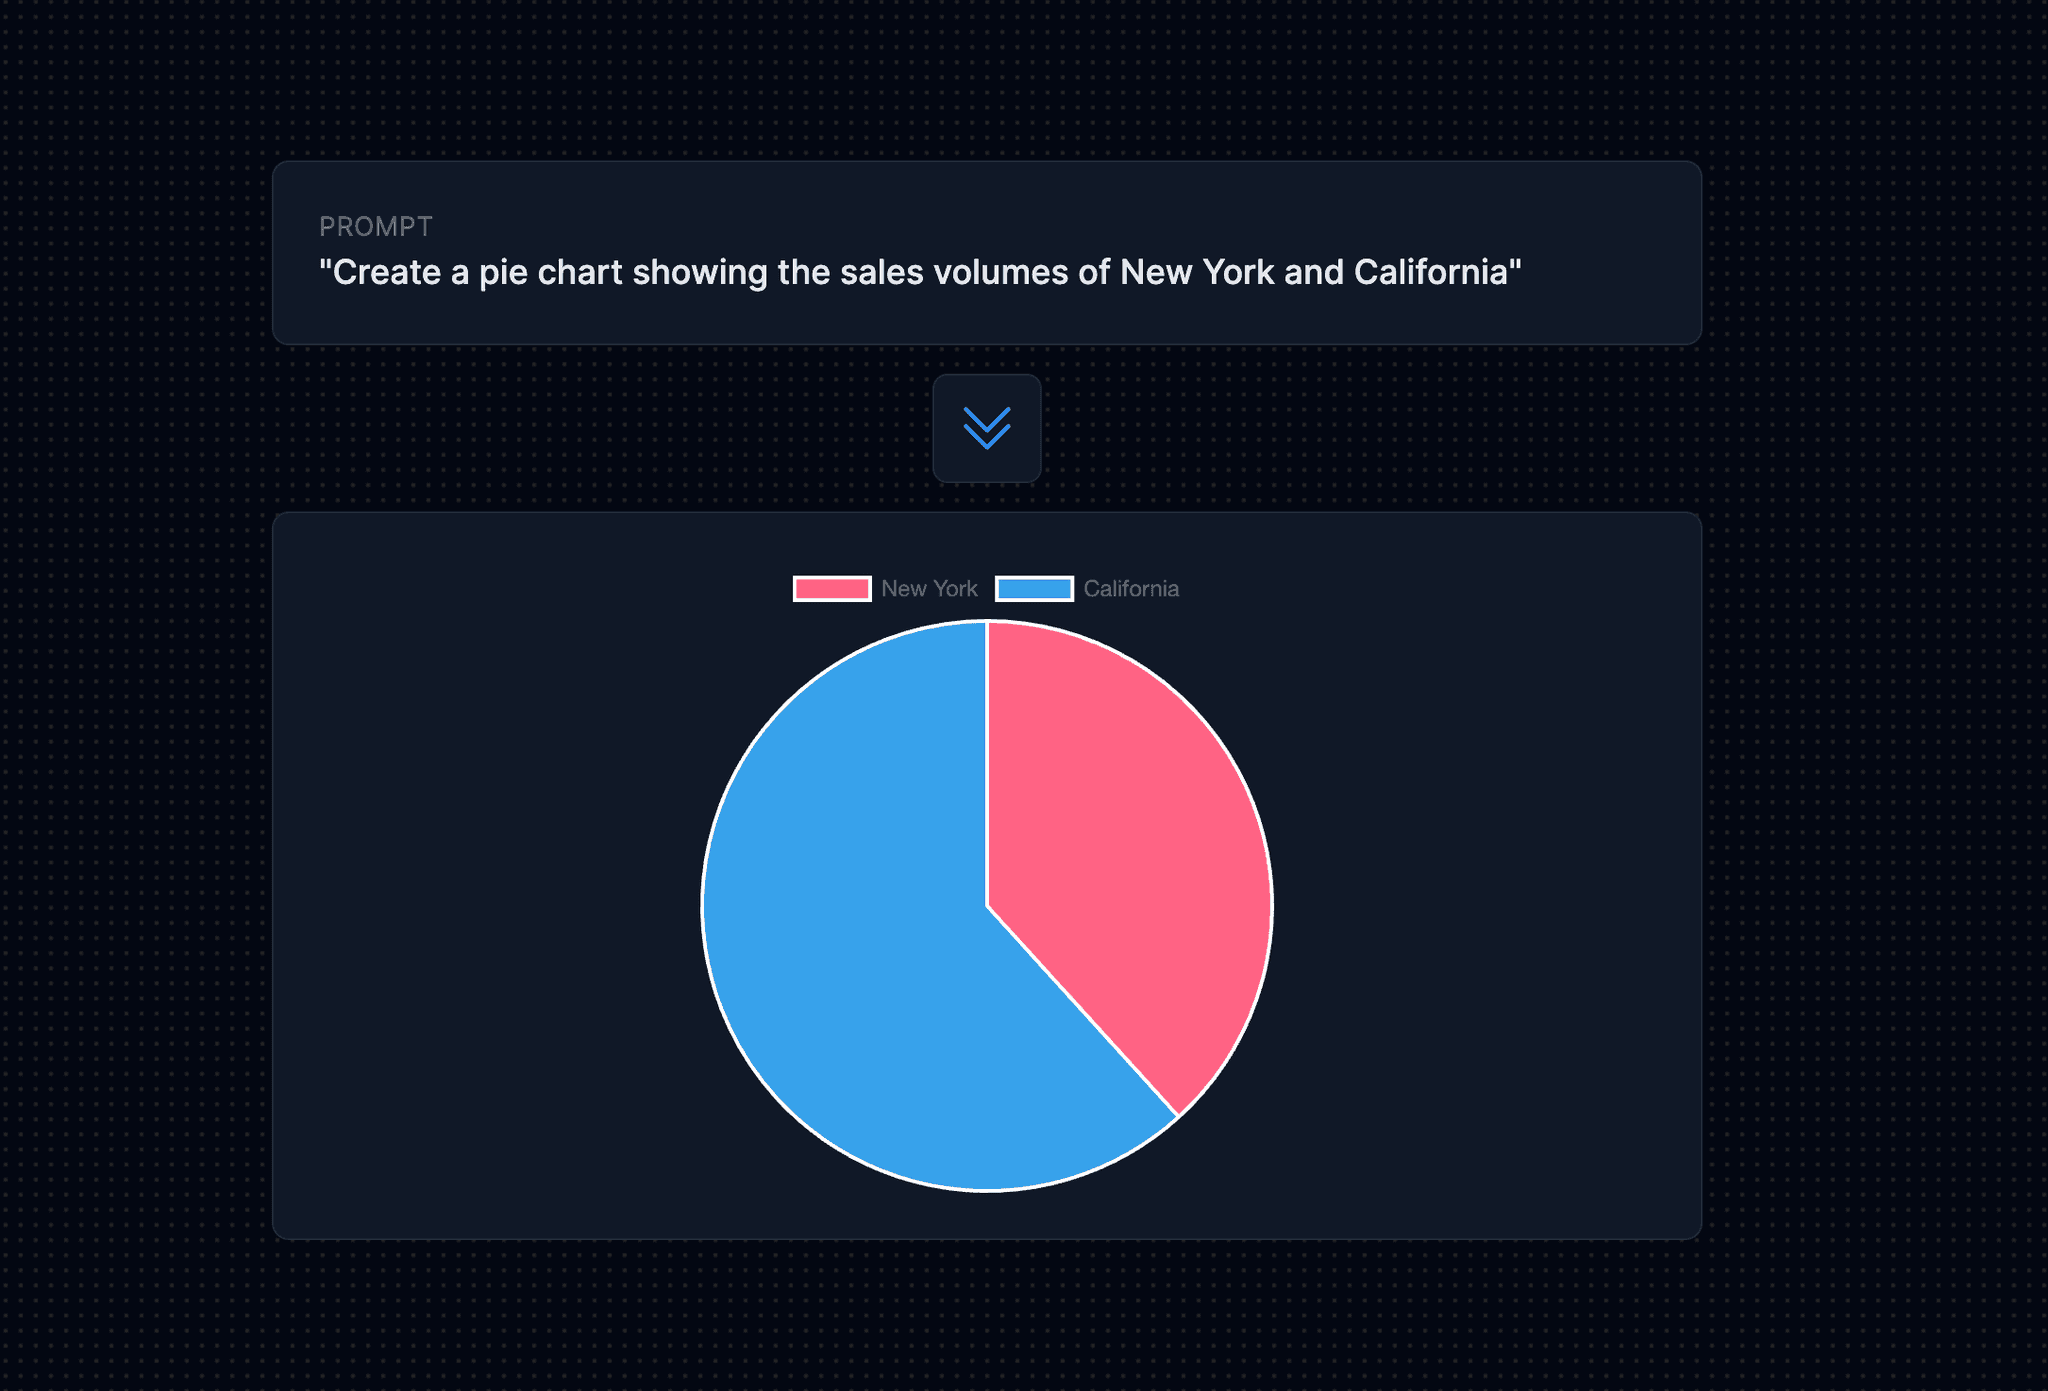
To ensure clarity and comprehensiveness, it is important to clearly specify the specific data fields that you would like to include in the chart. For instance, if you desire to create a bar chart that compares the sales figures across different regions, it is essential to mention the specific fields such as “Region” and “Sales” in your prompt. By providing this level of detail, it will facilitate a more accurate and precise representation of the data in the chart, enabling a better understanding of the sales performance across various regions.
Here are some example AI prompts that include specific data fields to ensure clarity and comprehensiveness:
These prompts specify the relevant data fields for each chart type, making it clear to the AI what information to include in the visualizations. This level of detail helps ensure that the generated charts accurately represent the data and the intended insights.
Provide Aggregation Instructions
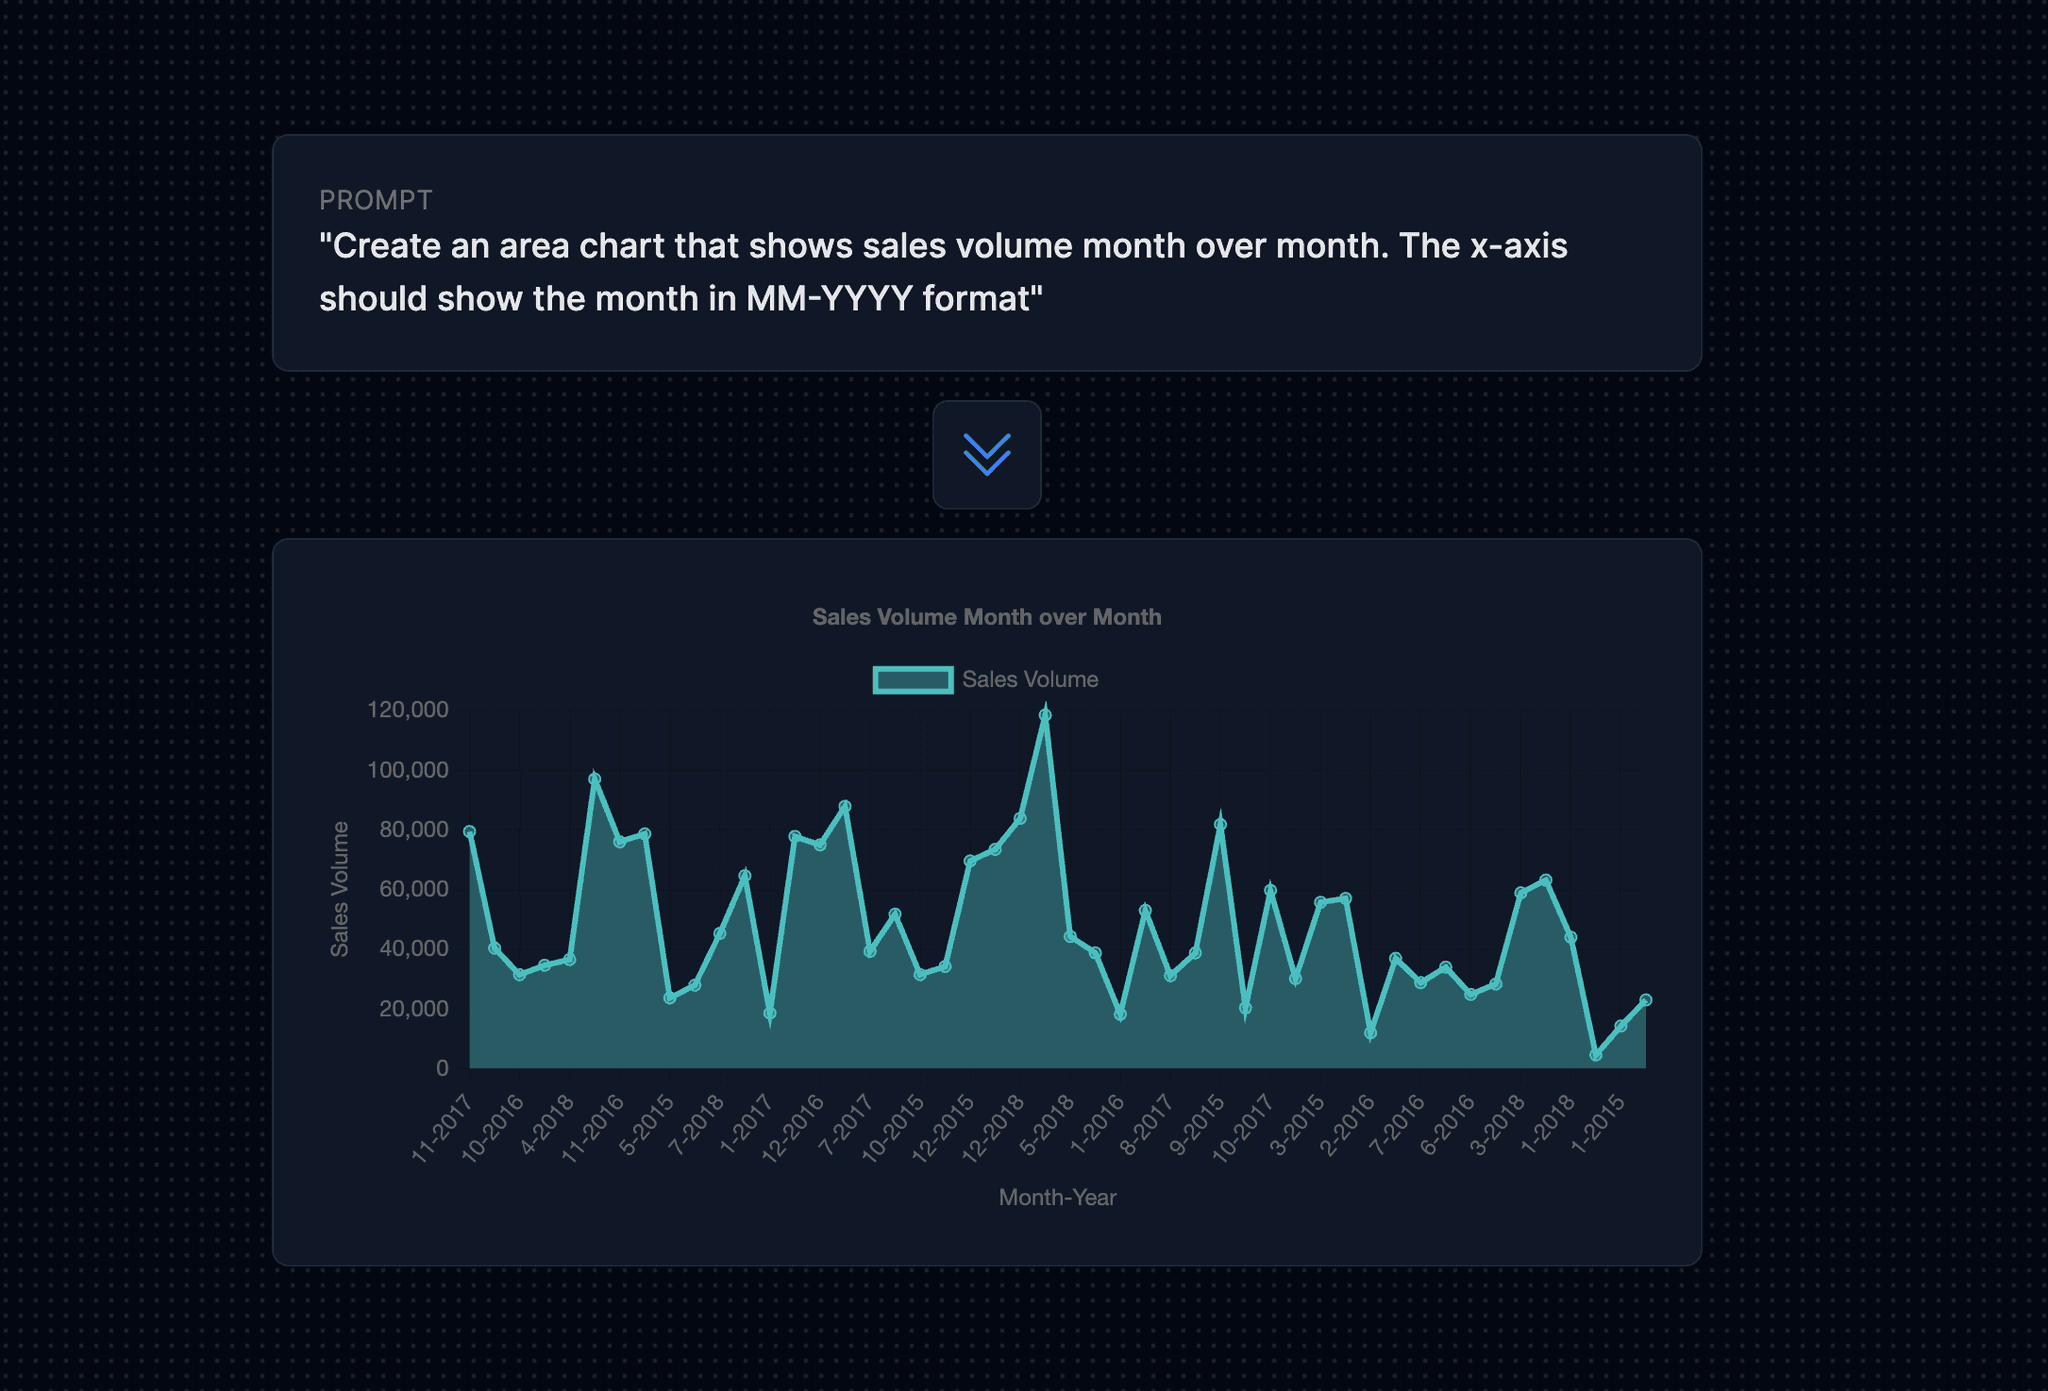
If you need the AI to aggregate or summarize data, please provide detailed instructions regarding the desired aggregation method. For example, you can specify that you want the AI to generate a bar chart illustrating the total sales per month. In order to accomplish this, kindly indicate that you require the AI to calculate the sum of the sales figures for each month. By clearly conveying your requirements, the AI will be able to accurately fulfill your request and produce the desired outcome.
Here are some example AI prompts that include detailed instructions for aggregating or summarizing data:
These prompts provide clear instructions on data aggregation methods to ensure the AI produces the desired outcome with accurate summaries and visualizations.
Add Filtering Criteria
If you want to filter the data based on specific conditions, include the filtering criteria in your prompt. This will allow you to narrow down the data to only what you need. For example, if you only want to include sales data for a particular product category, mention the category name in your prompt. By specifying the category, you can ensure that the data you receive is relevant and accurate. This is especially useful when dealing with large datasets, as it helps you focus on the specific information you require. So remember, when requesting data, be clear about the filtering criteria you want to apply, such as the product category, to get the most relevant and useful results.
Here are some example AI prompts that include filtering criteria to ensure that the generated data or charts are specific to certain conditions:
These prompts include specific filtering criteria to ensure that the generated data or charts are tailored to the conditions or categories you want to focus on, resulting in more relevant and useful results.
Specify Sorting Order
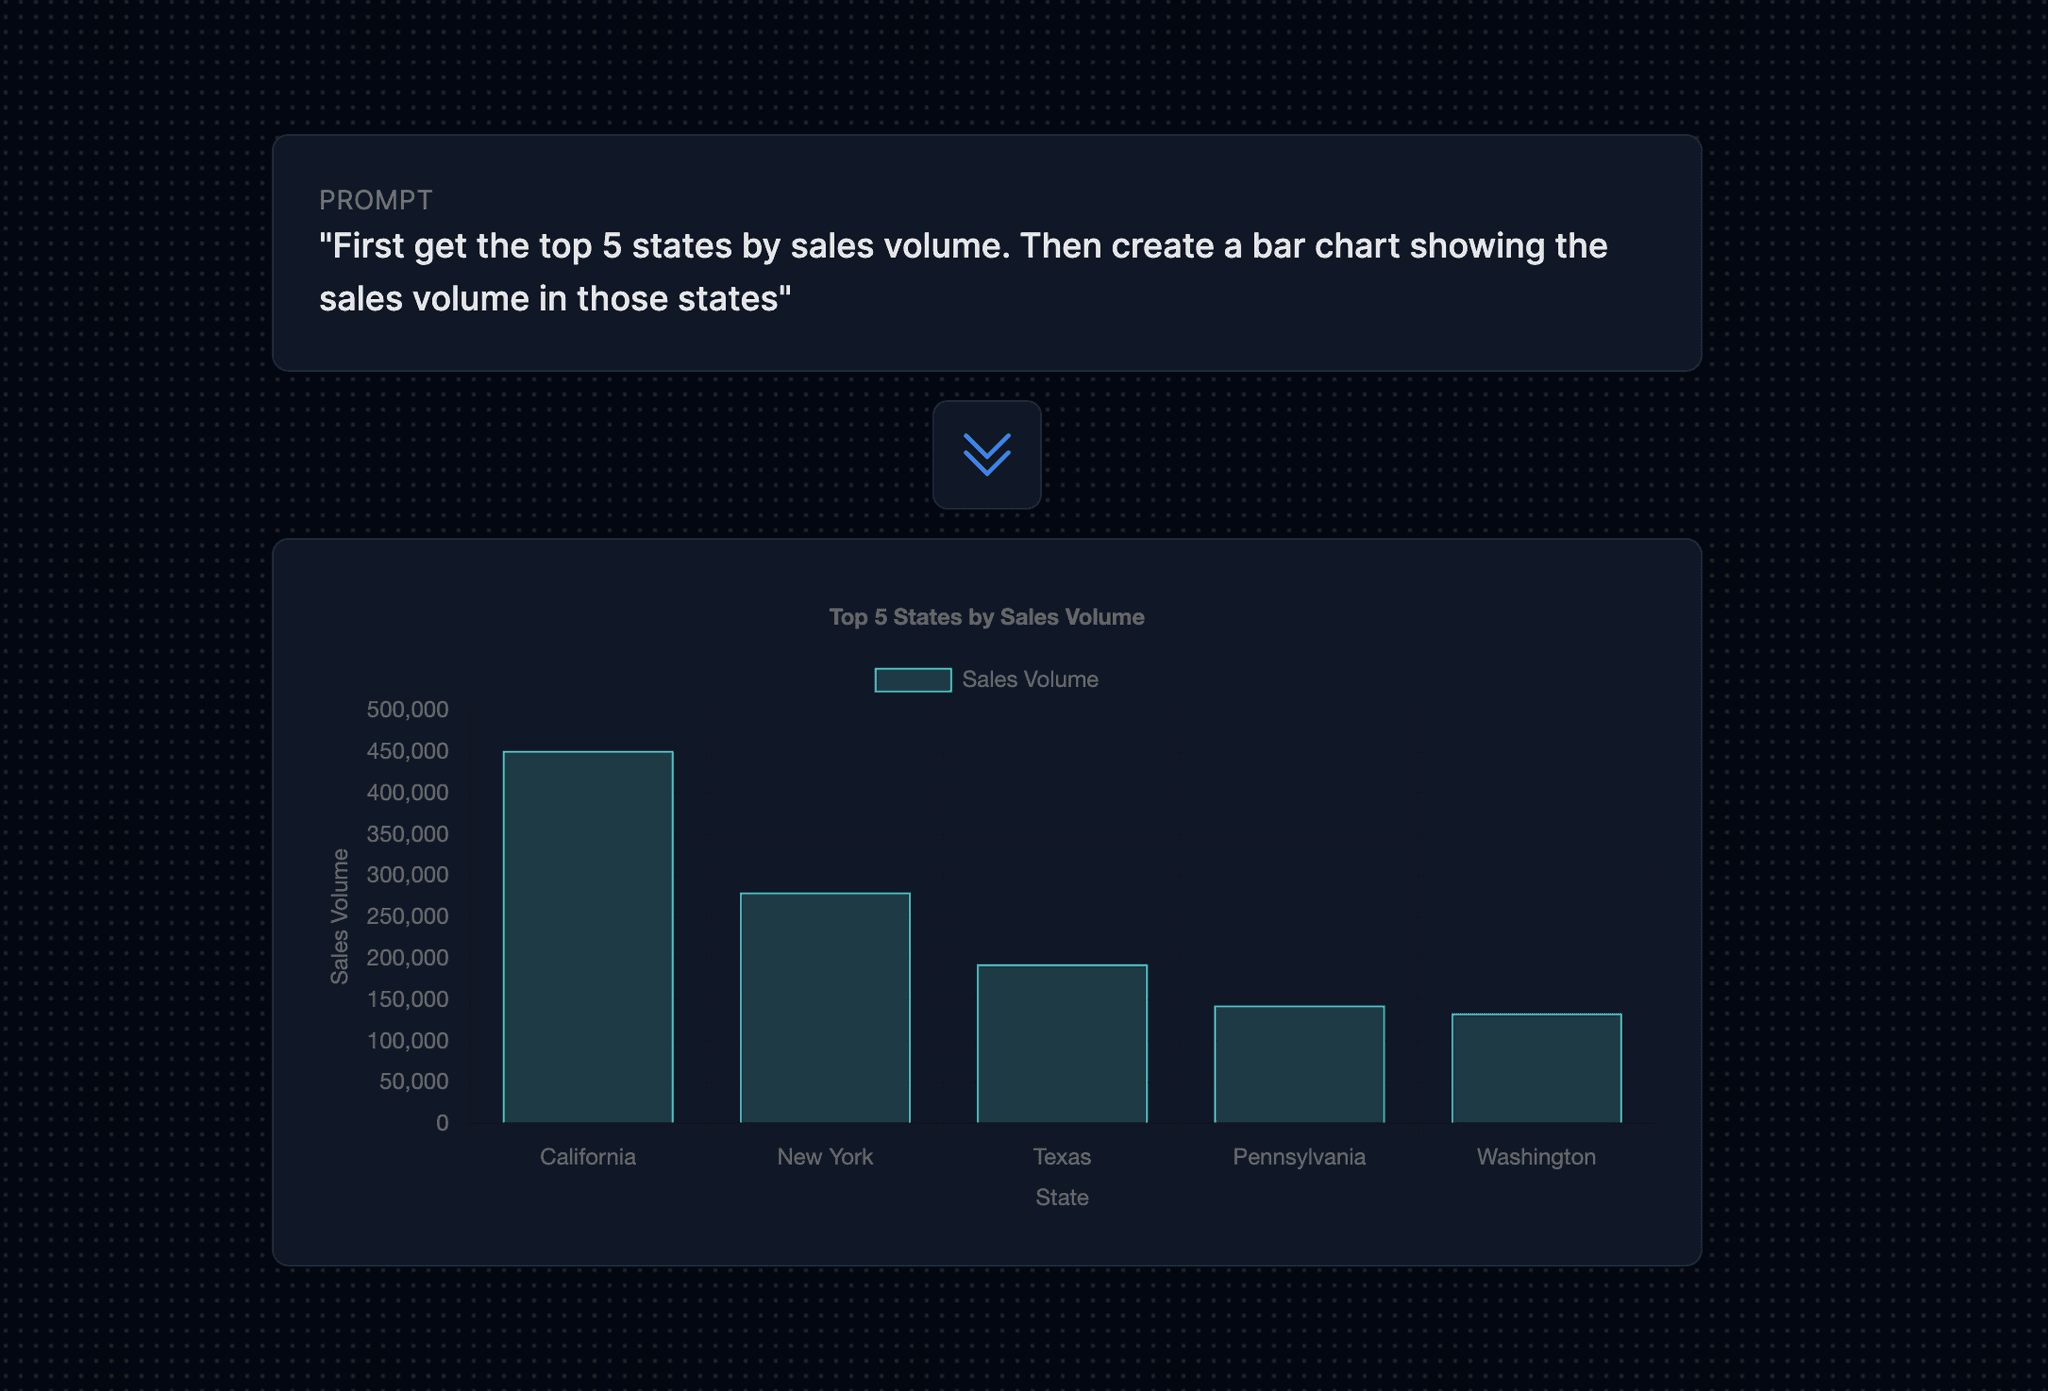
If you want the chart to display the data in a specific order, it is important to provide clear instructions for sorting. By specifying the desired order, you can ensure that the chart accurately reflects the intended presentation of the data. For example, if you want a bar chart to show the sales figures in a descending order, it is crucial to mention this requirement in your prompt. This way, the chart will effectively showcase the sales performance from highest to lowest, allowing viewers to easily identify trends and patterns. Remember, providing detailed instructions for sorting will enhance the overall clarity and effectiveness of the chart.
Here are some example AI prompts that include clear instructions for sorting data in a specific order to enhance the clarity and effectiveness of the chart:
These prompts provide clear instructions for sorting data in specific orders, ensuring that the generated charts effectively reflect the intended presentation of the data, making it easier for viewers to identify trends and patterns.
Include Formatting Preferences
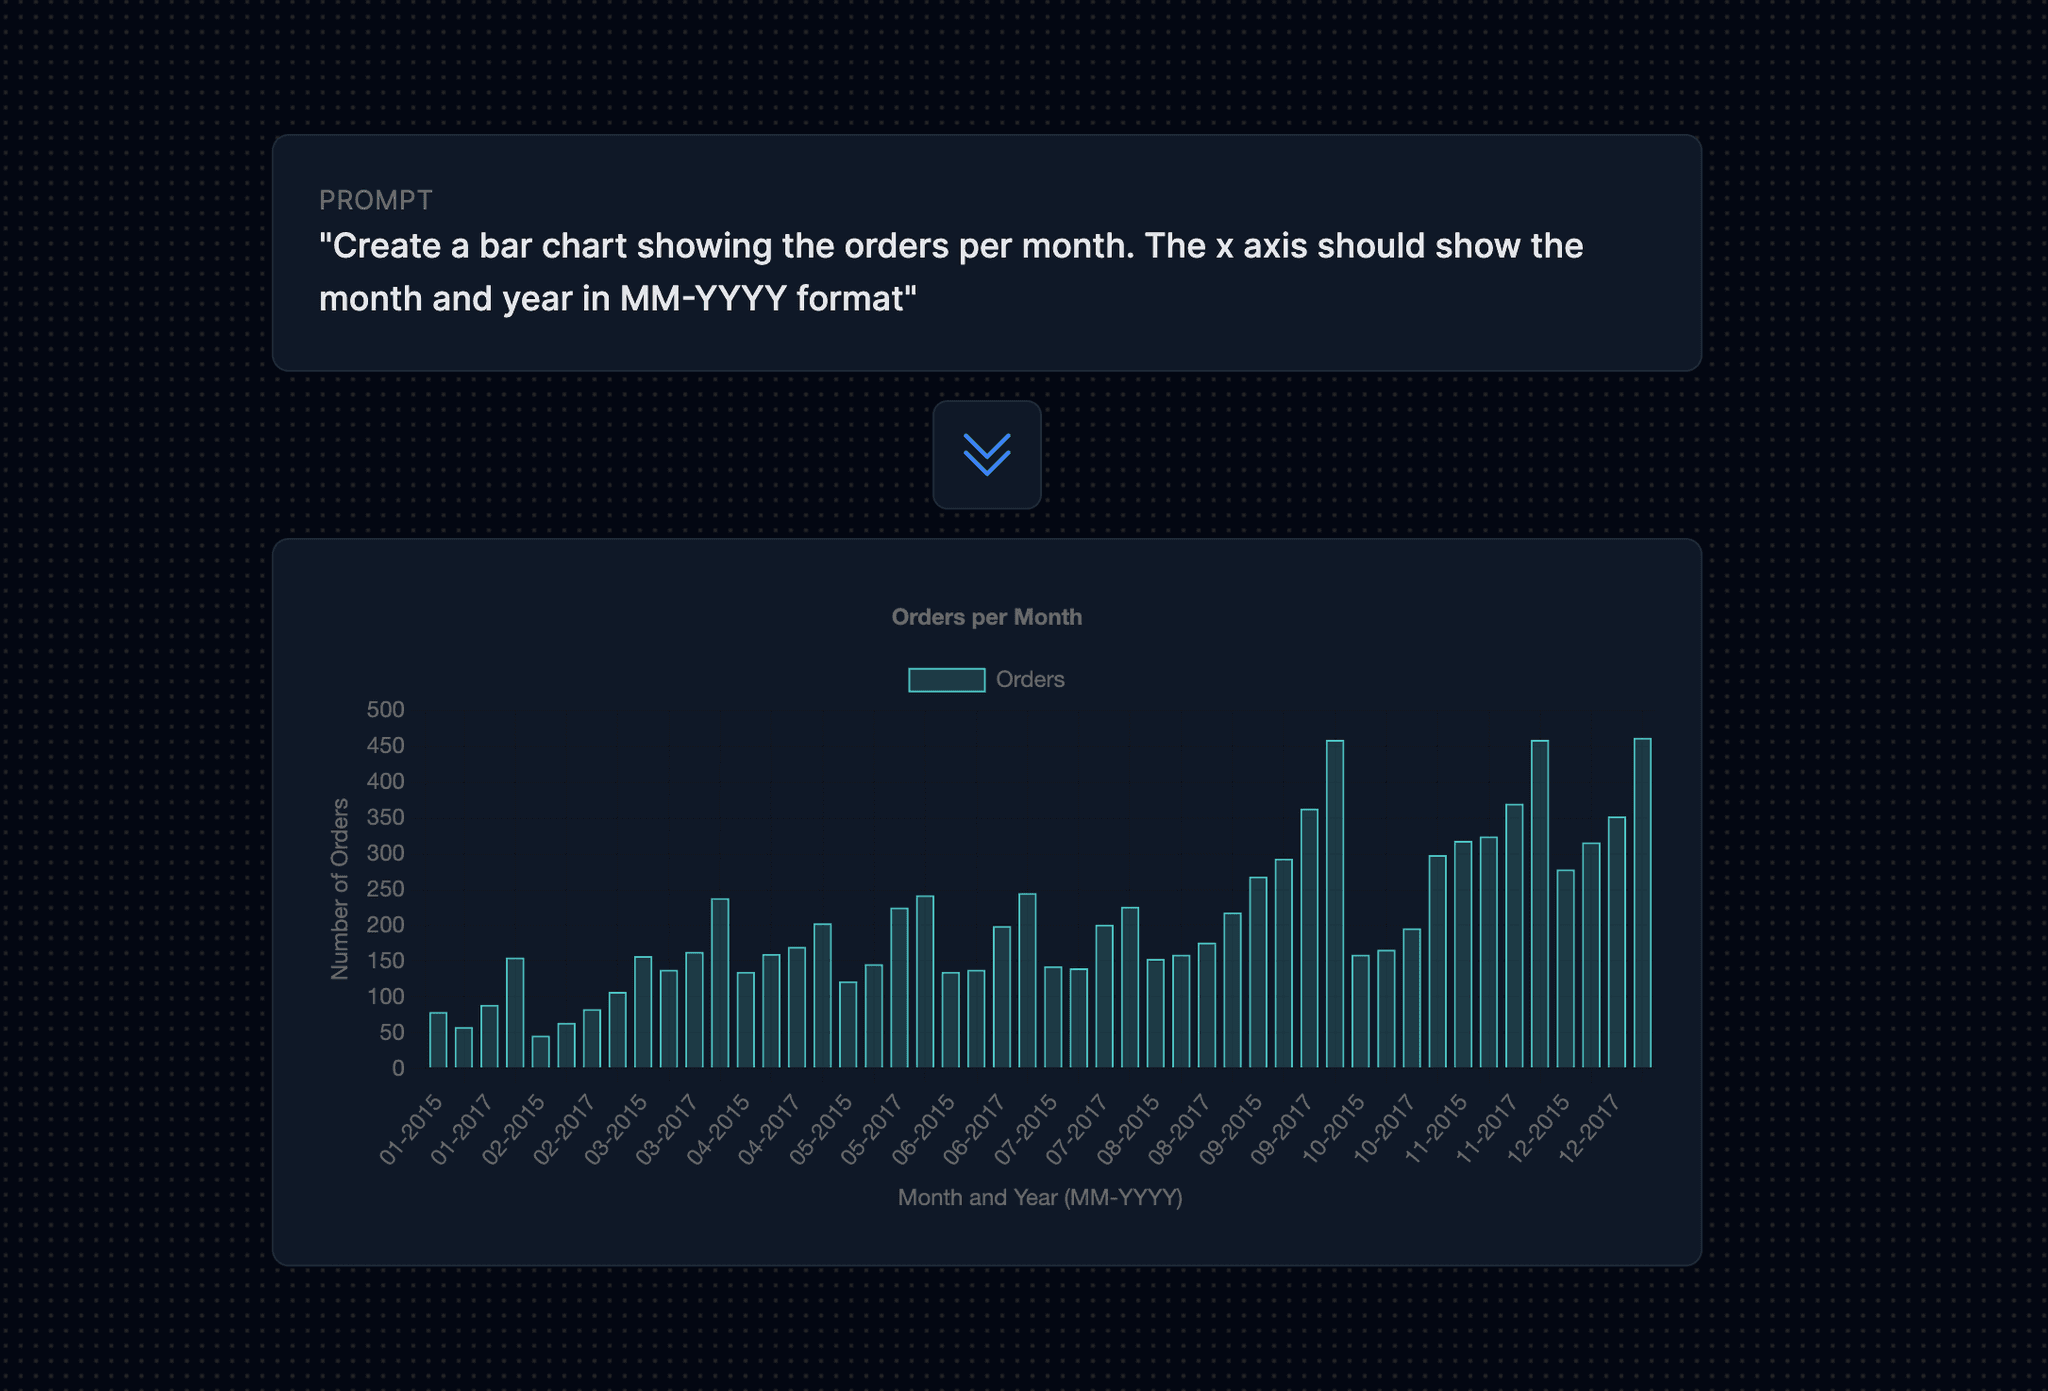
If you have any specific formatting preferences for the chart, such as color schemes or axis labels, please mention them in your prompt. Providing detailed instructions about your desired visual style will assist the AI in generating a chart that perfectly aligns with your preferences and enhances the overall visual appeal. Additionally, feel free to provide any specific requirements or guidelines to ensure that the chart accurately represents and conveys the data you intend to present.
Here are some example AI prompts that include specific formatting preferences for charts to ensure they align with your desired visual style:
These prompts include specific formatting preferences to ensure the charts align with your desired visual style, making them visually appealing and effective in conveying the data.
Review and Refine
After you have finished writing your AI prompt, it is essential to take a few moments to carefully review it for clarity and completeness. This review process allows you to ensure that all the necessary information has been adequately included in the prompt and that it accurately reflects your intentions. If you find any areas where additional details or clarification is needed, take the opportunity to revise and refine the prompt accordingly. By doing so, you can effectively convey your requirements and ensure that they are understood by others.