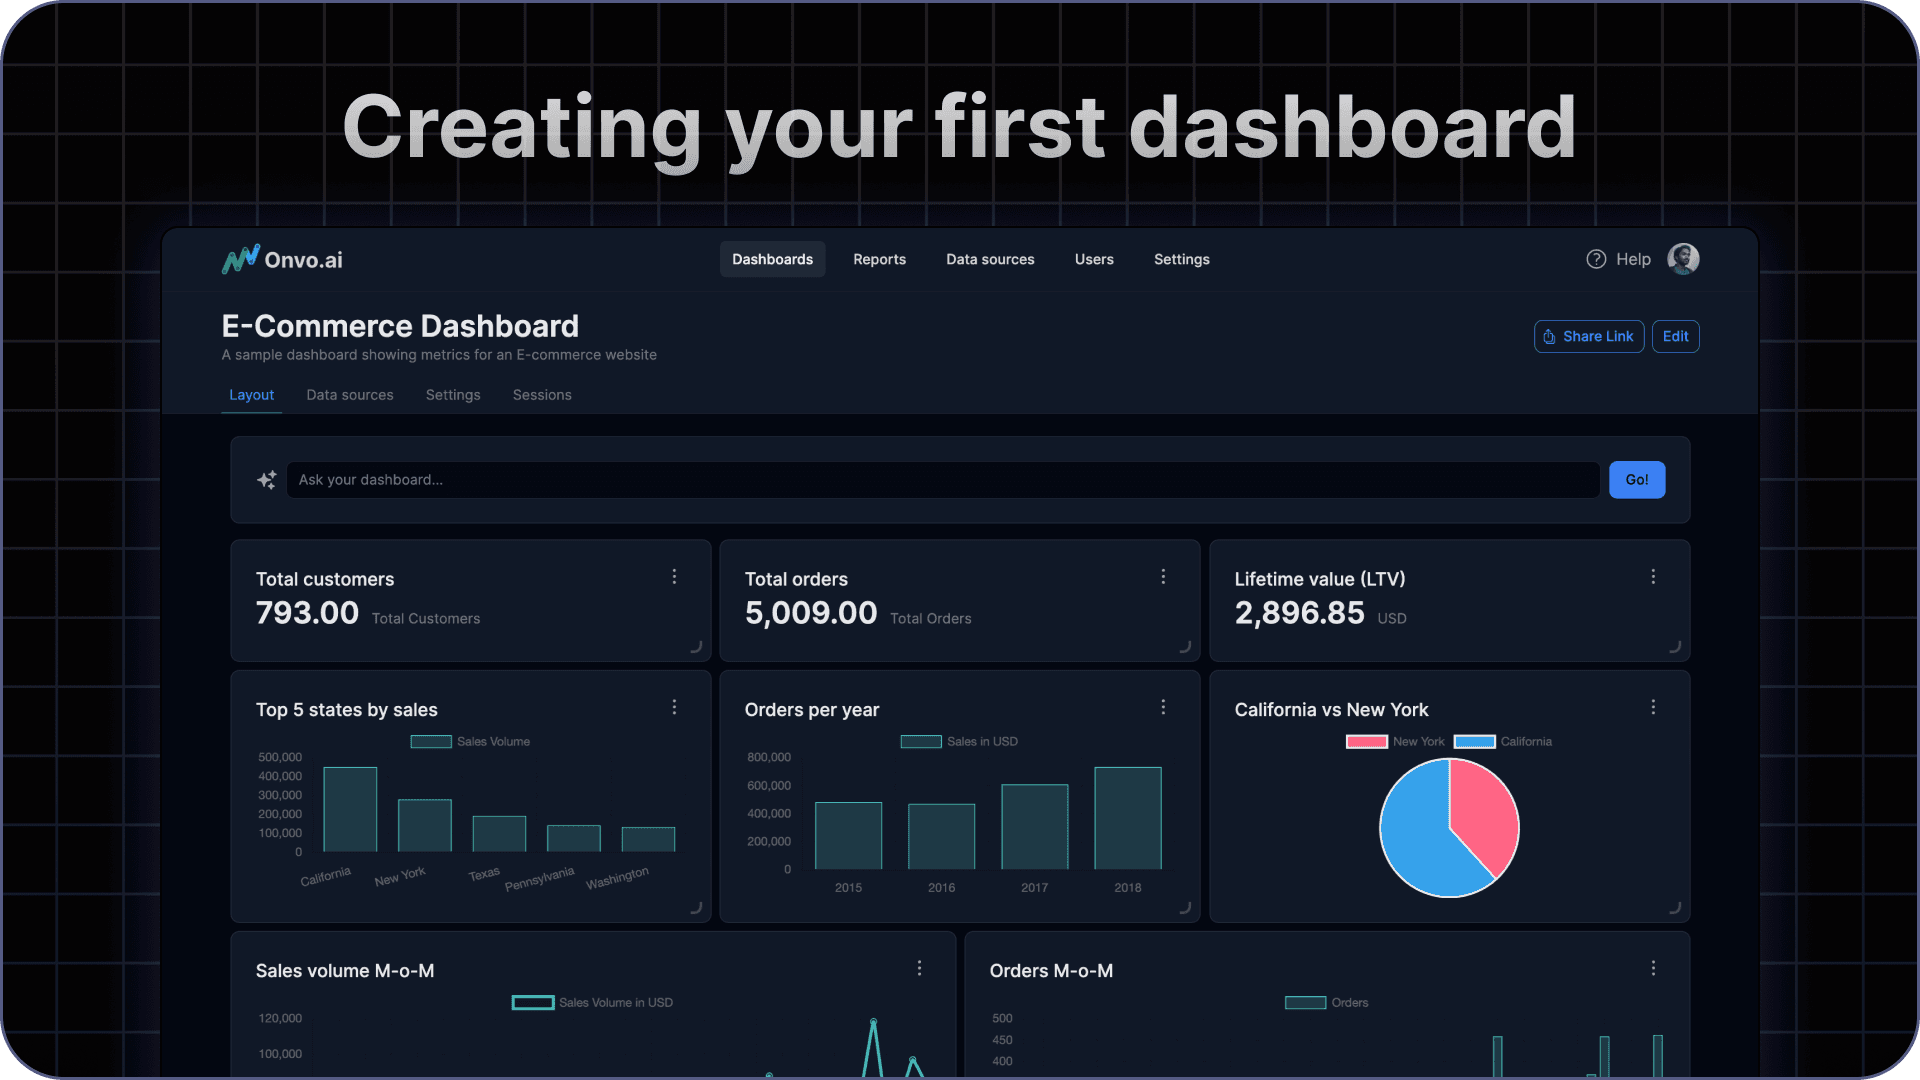
Creating your first dashboard
This section will walk you through creating your first dashboard using the power of AI

Creating an account
To get started, first create an account at here . We offer 14 day free trials on our platform so you can try it out risk free.
Connect a datasource
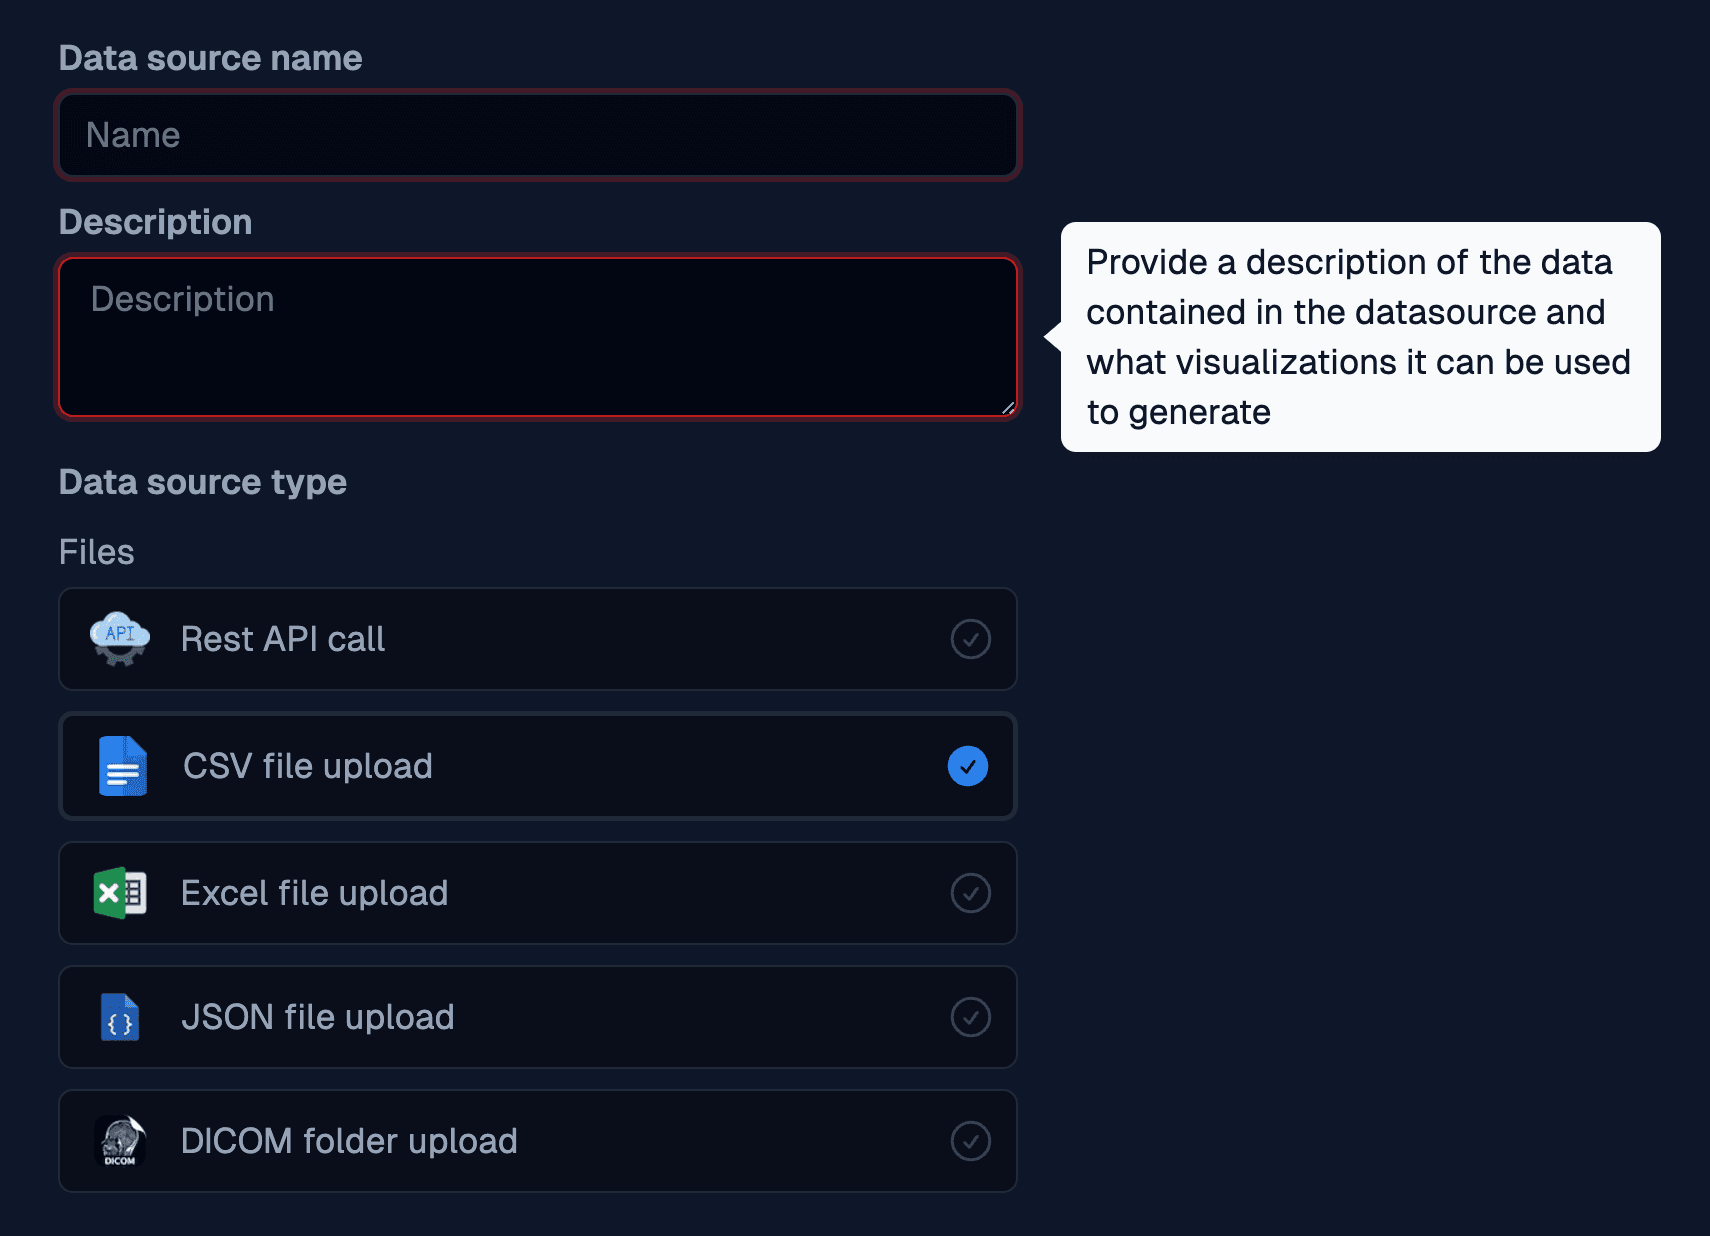
Next, you can connect a datasource, this could be an API request, a database link, an excel/csv file or one of Onvo’s many integrated one-click connectors. Just head over to the data sources page and click on New Data Source. Now fill in a name, a description and the type of data source and click Create datasource.

On the page that appears, you can now fill in the remaining details and click Save Changes. The AI now kicks in to try and understand your data source better. Once this step is done, you can fine tune the column descriptions to be more descriptive and make your data more understandable.

Create a dashboard
With the datasource linked, you can now create a dashboard to visualize the data. Head over to the dashboards page and click on New Dashboard. You can now fill in the name of the dashboard, an optional description and pick the data sources you want to use for the dashboard. Then click Create dashboard.

You will be then taken to a blank page which is the canvas you can build your dashboard on. Click on the button that says Ask AI... at the bottom.
You can can now create your first widget by typing what you want in plain English and clicking on the up arrow or hitting enter.

The AI will then take over, analyze the datasources you have connected and build out the chart.

At this point you can follow up by asking for changes to the report like changing the colors, adding a trend line and so on. But if you are happy with the chart, you can click on the Add to dashboard button and the chart should be saved to your dashboard.
You can repeat this process to create all the charts and tables you may need. You can even resize and scale each widget on the dashboard to make the perfect layout.